AI Neurology & Neuro-Oncology

svgexport-1

NeuroQuant® PET

Automated amyloid PET analysis for clear, standardized insights.

NeuroQuant® PET

Rapid, Automated Amyloid PET Quantification and Centiloid Scoring

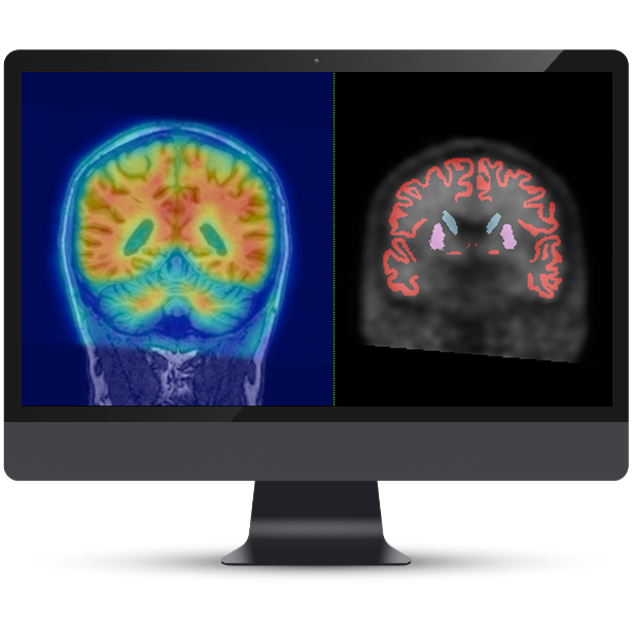
NeuroQuant® PET provides fully automated amyloid PET quantification, combining regional analysis and Centiloid scoring to support the interpretation of established biomarkers.

FDA 510(k) CLEARED (K261916)

Clearer Insights into Lesion Changes

Amyloid Quantification

Standardized Amyloid Reporting and Centiloid Quantification to Support Established Biomarker Interpretation

Support clinical assessment with objective volumetric data and color-coded brain structure images to inform diagnosis, treatment, and lifestyle planning. Assess lesion dissemination and distribution patterns, identify areas with the greatest lesion burden, and track lesions across orthogonal views.

NeuroQuant® PET Benefits

Smarter PET Analysis

Reporting options

Amyloid tracer reporting and regions of interest.

Clear visualization

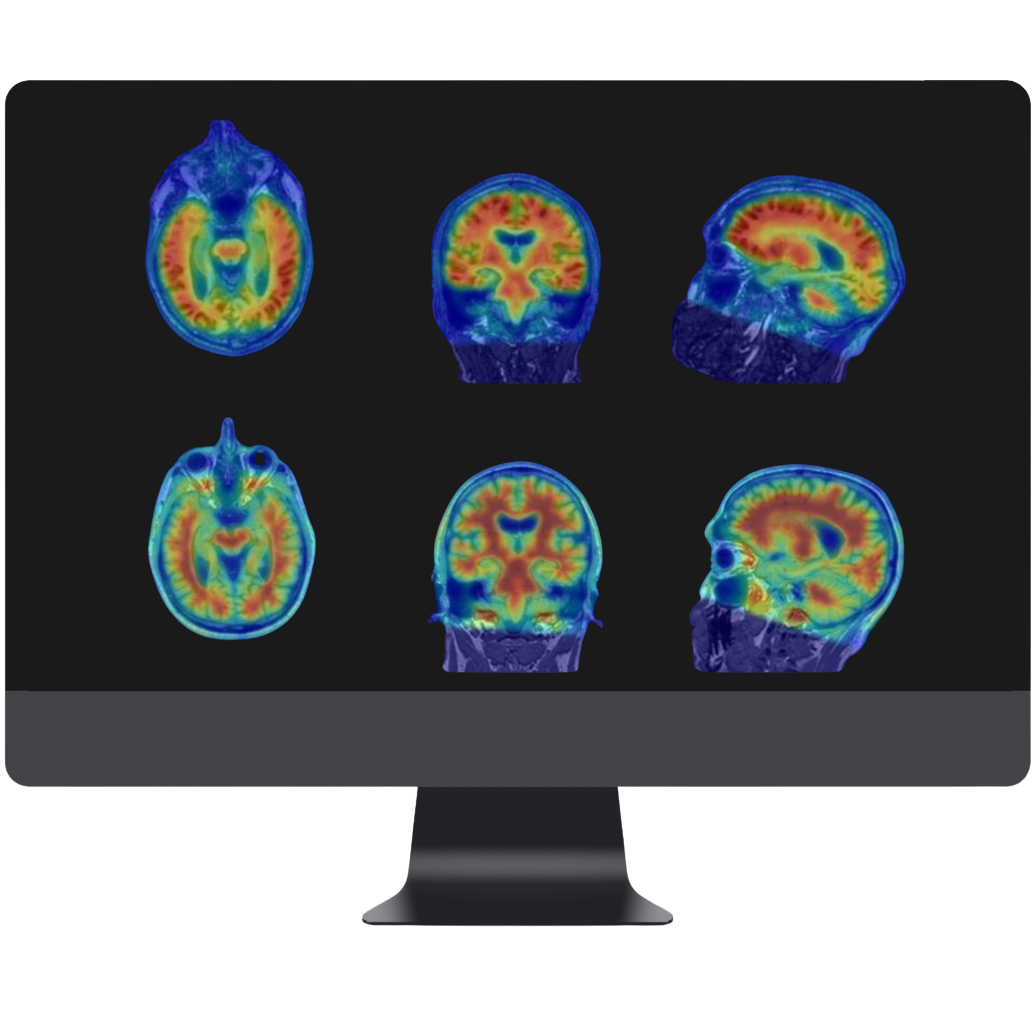
Fusion images and anatomical overlays.

Automated processing

Automated cloud-based processing.

Reports

NeuroQuant® PET

Powered by NeuroQuant® for trusted, proven brain segmentation and analysis.

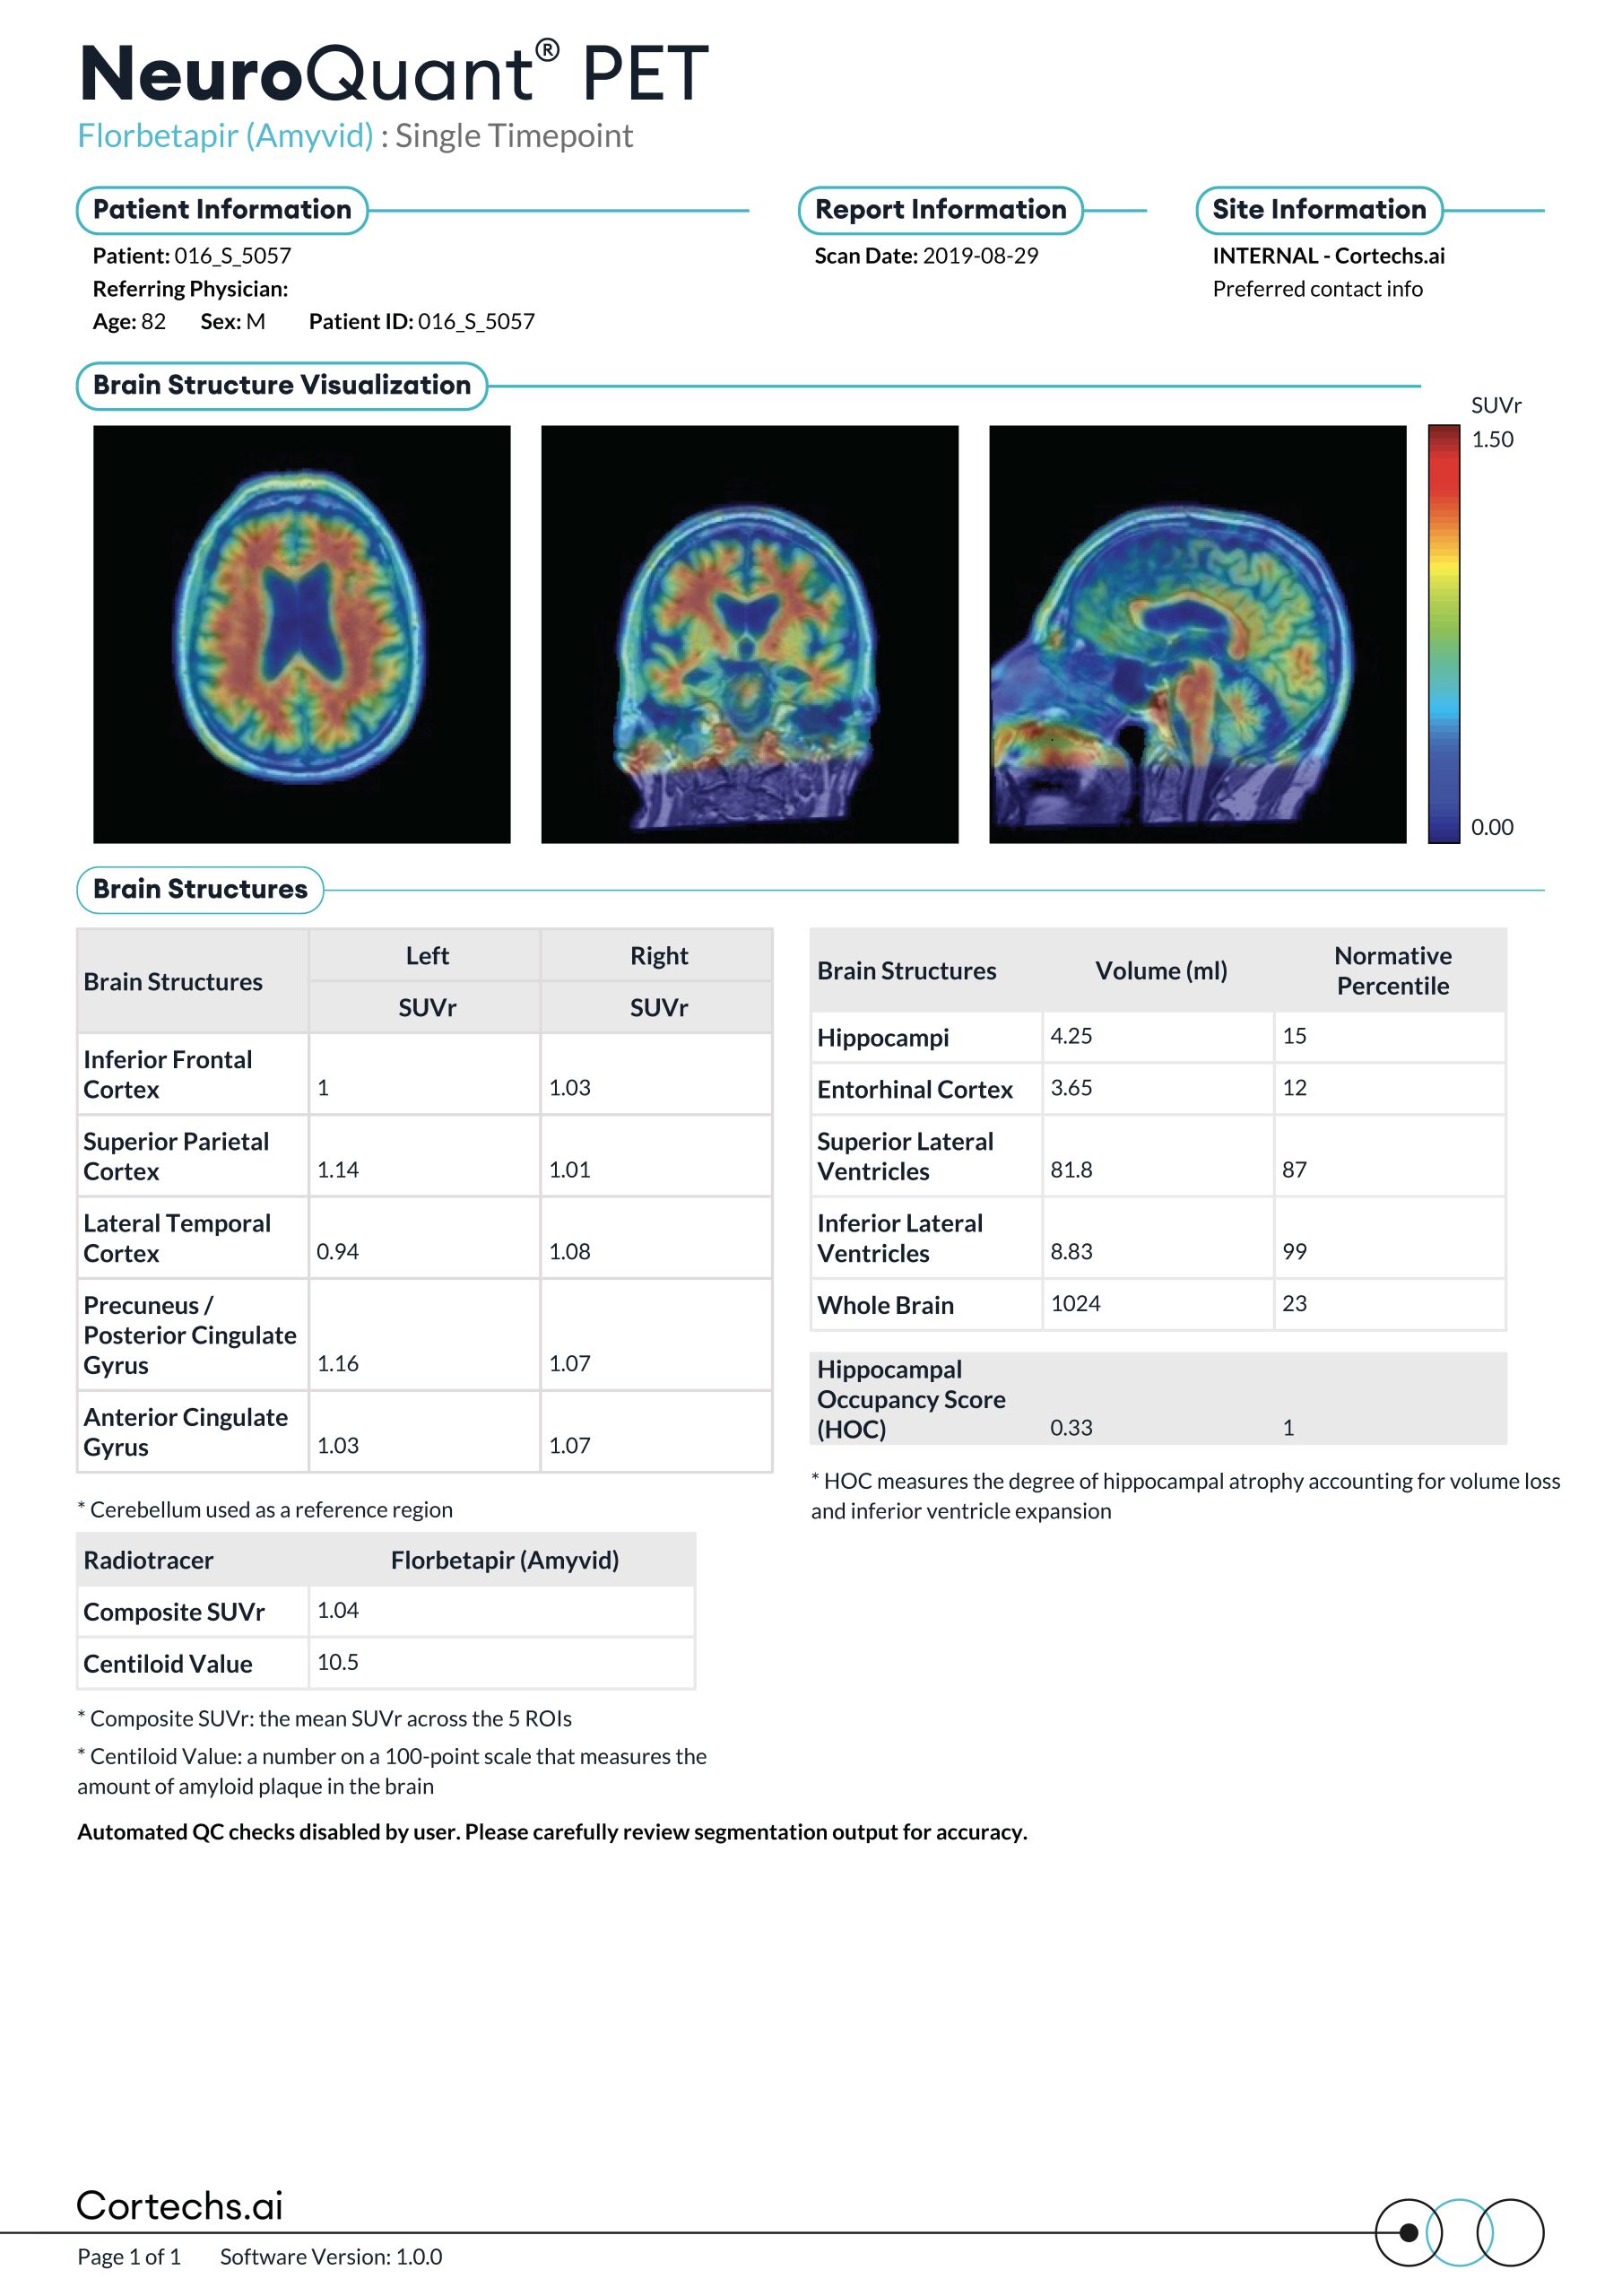
Florbetapir Report

The NeuroQuant® PET Florbetapir Report automatically quantifies amyloid tracer binding within brain structures, providing visual and statistical comparisons of normalized regional PET tracer values against normative population data. The report also includes a Centiloid value.

Florbetaben Report

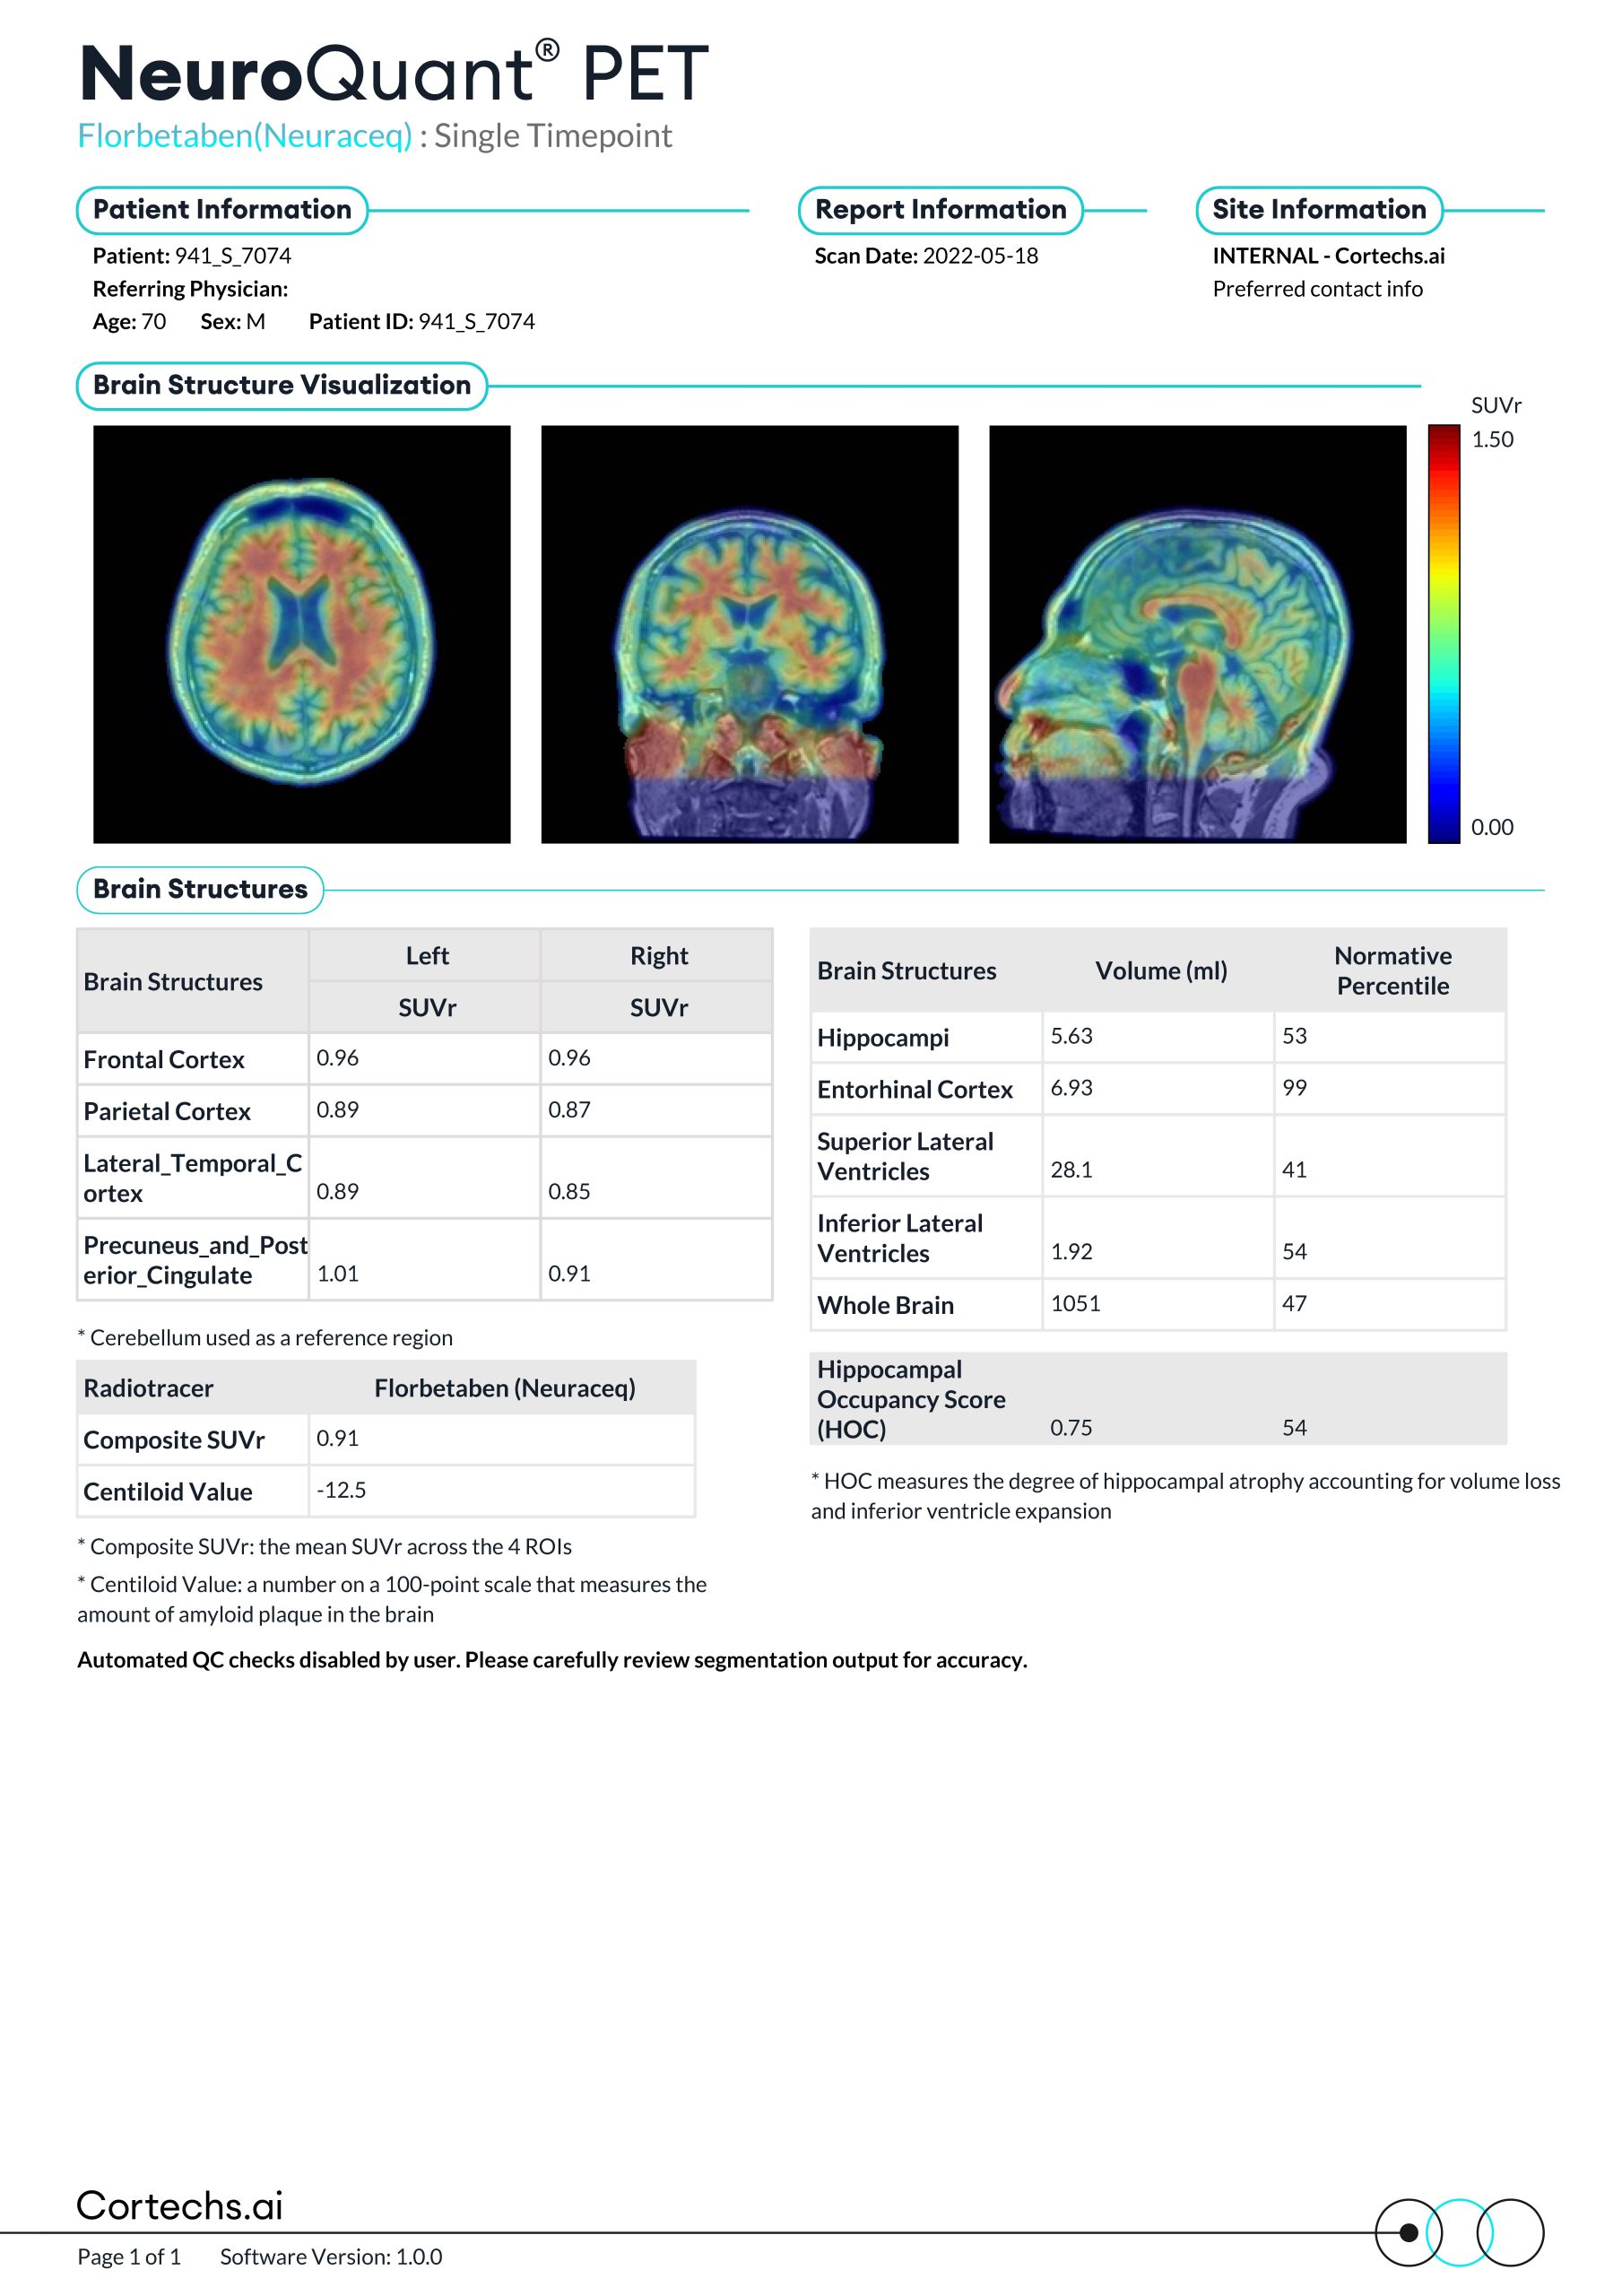
The NeuroQuant® PET Florbetaben Report automatically quantifies amyloid tracer binding within brain structures, providing visual and statistical comparisons of normalized regional PET tracer values against normative population data. The report also includes a Centiloid value.

Flutemetamol Report

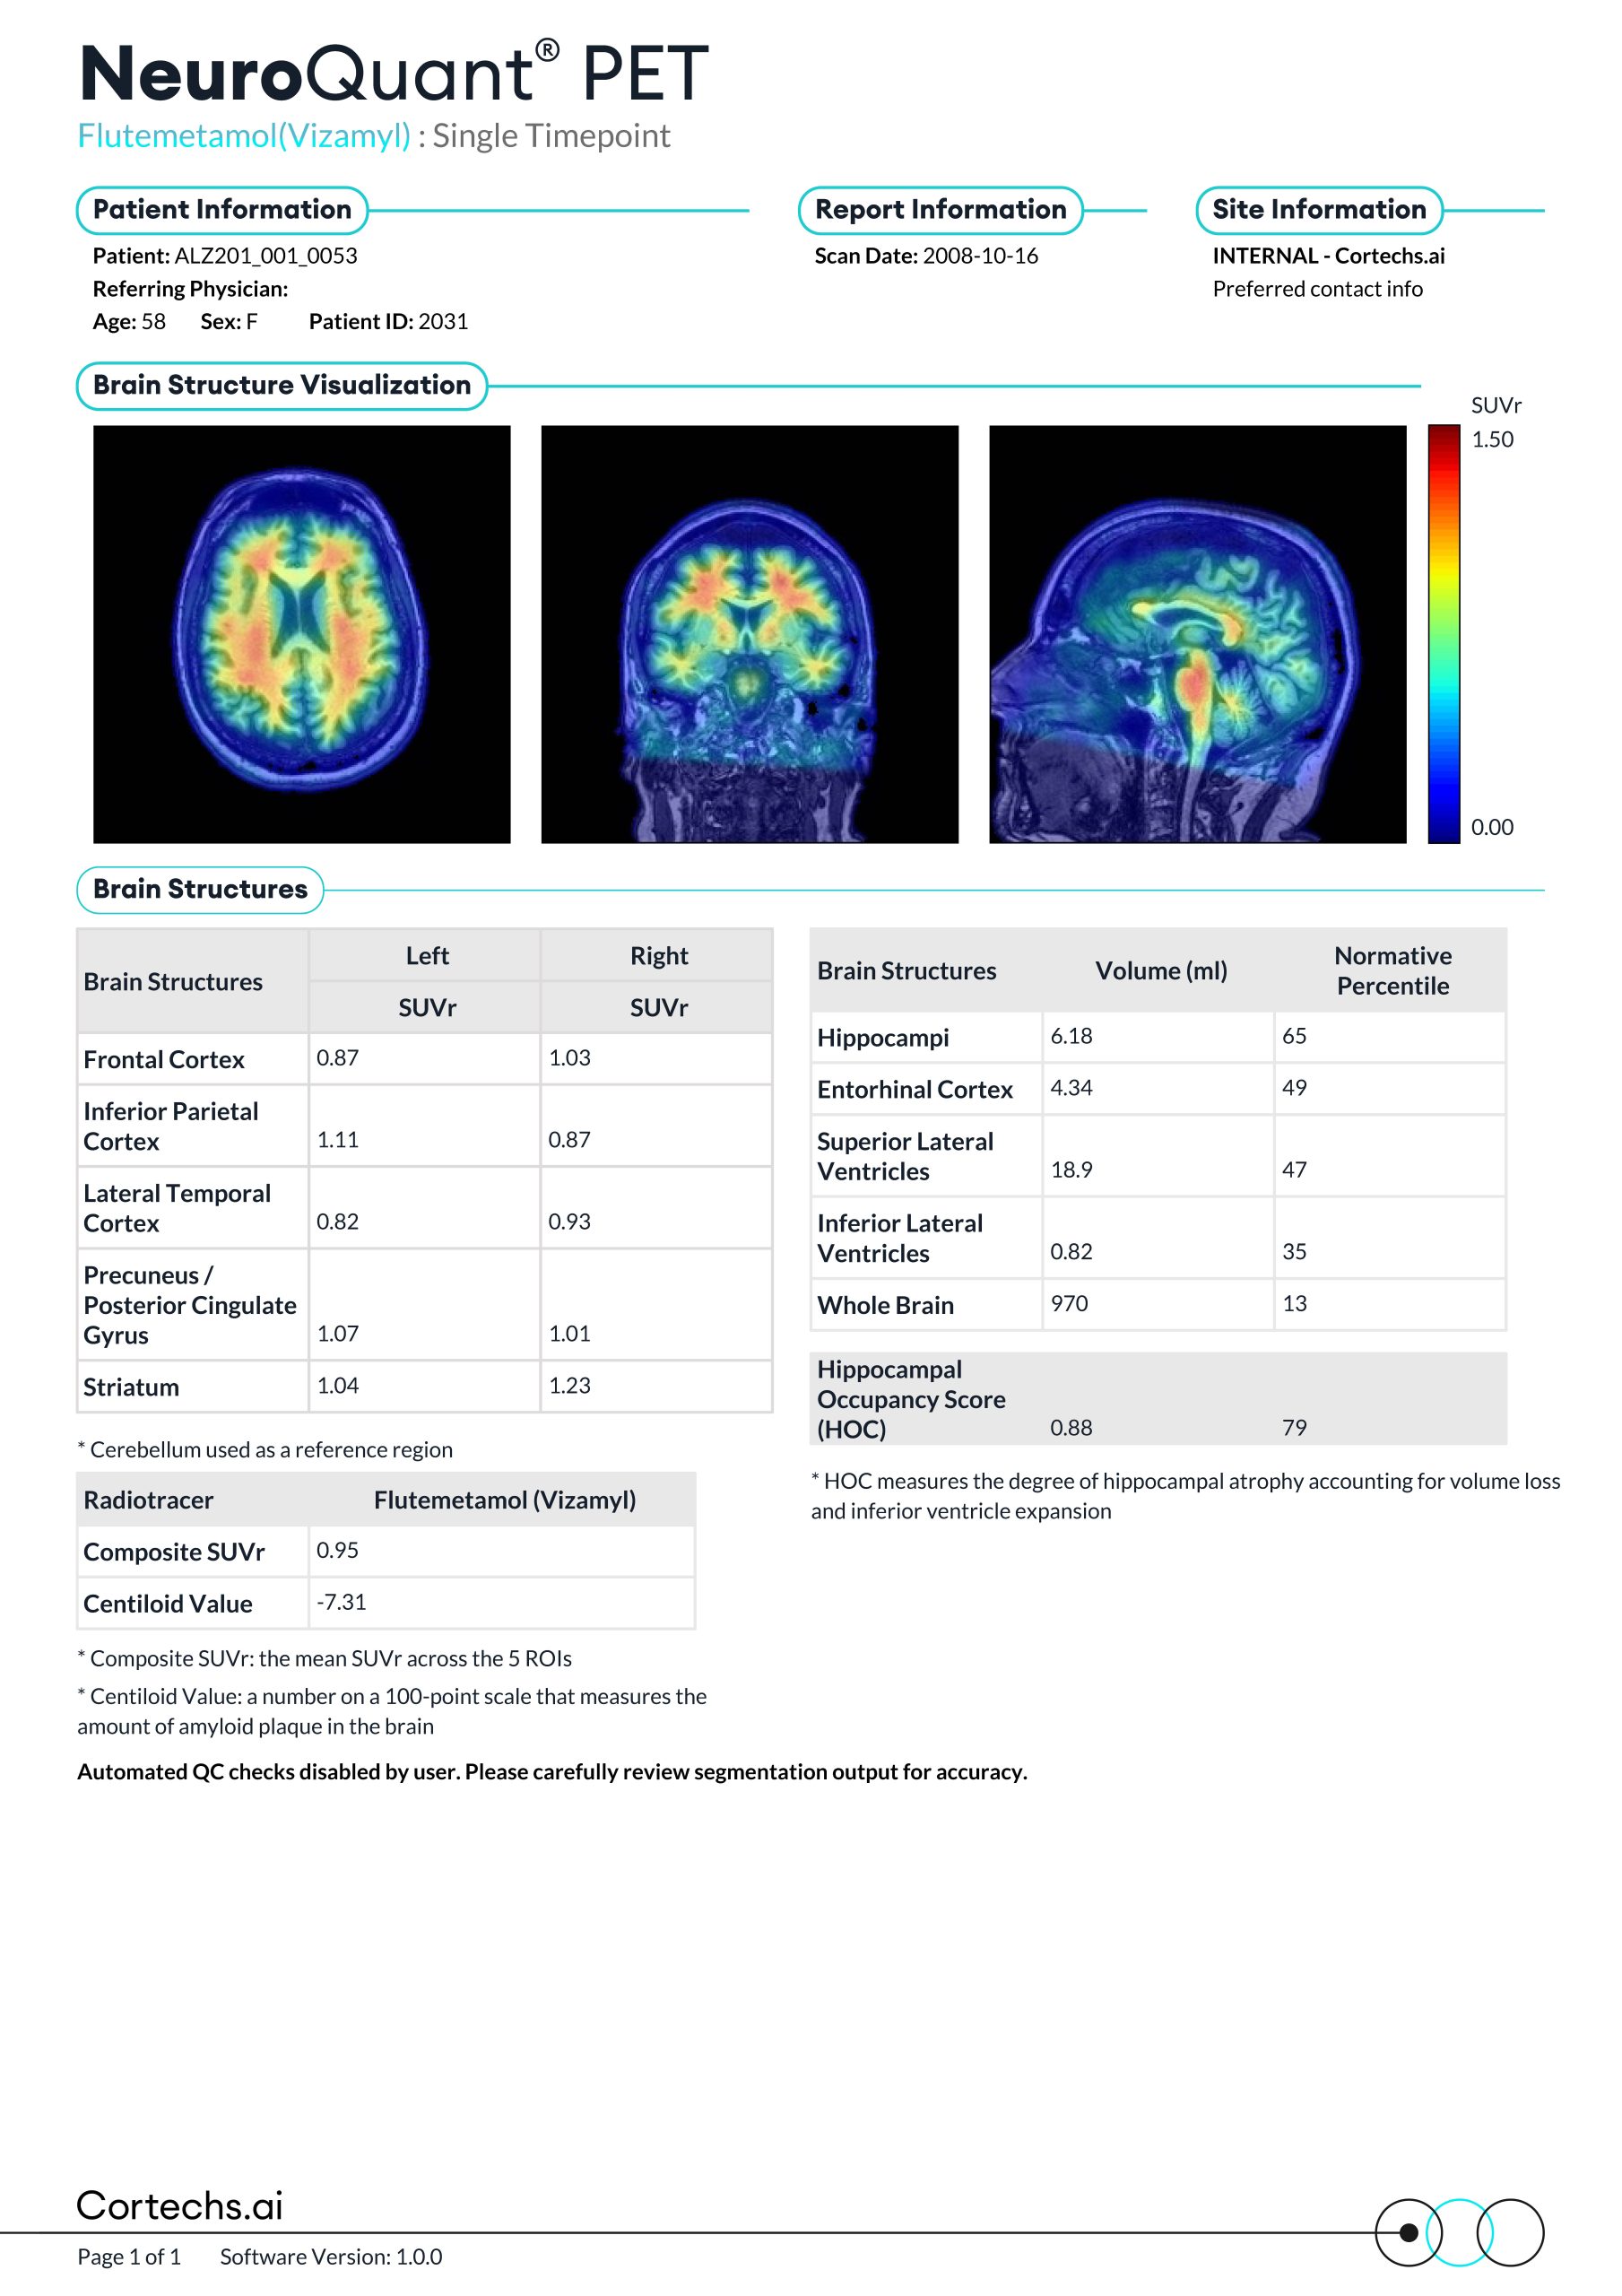
The NeuroQuant® PET Flutemetamol Report automatically quantifies amyloid tracer binding within brain structures, providing visual and statistical comparisons of normalized regional PET tracer values against normative population data. The report also includes a Centiloid value.

NeuroQuant® PET

Research Applications

Explore additional NeuroQuant® PET outputs for regional quantification and comparison in research studies.

FDG Report

Provides regional quantification of glucose metabolism.

Flortaucipir (Tau) Report

Quantifies tau tracer uptake across brain regions.

Z-Score Reporting

Compares regional values against normative population data.

Research Reports

NeuroQuant® PET

Powered by NeuroQuant® for trusted, proven brain segmentation and analysis.

FDG Report

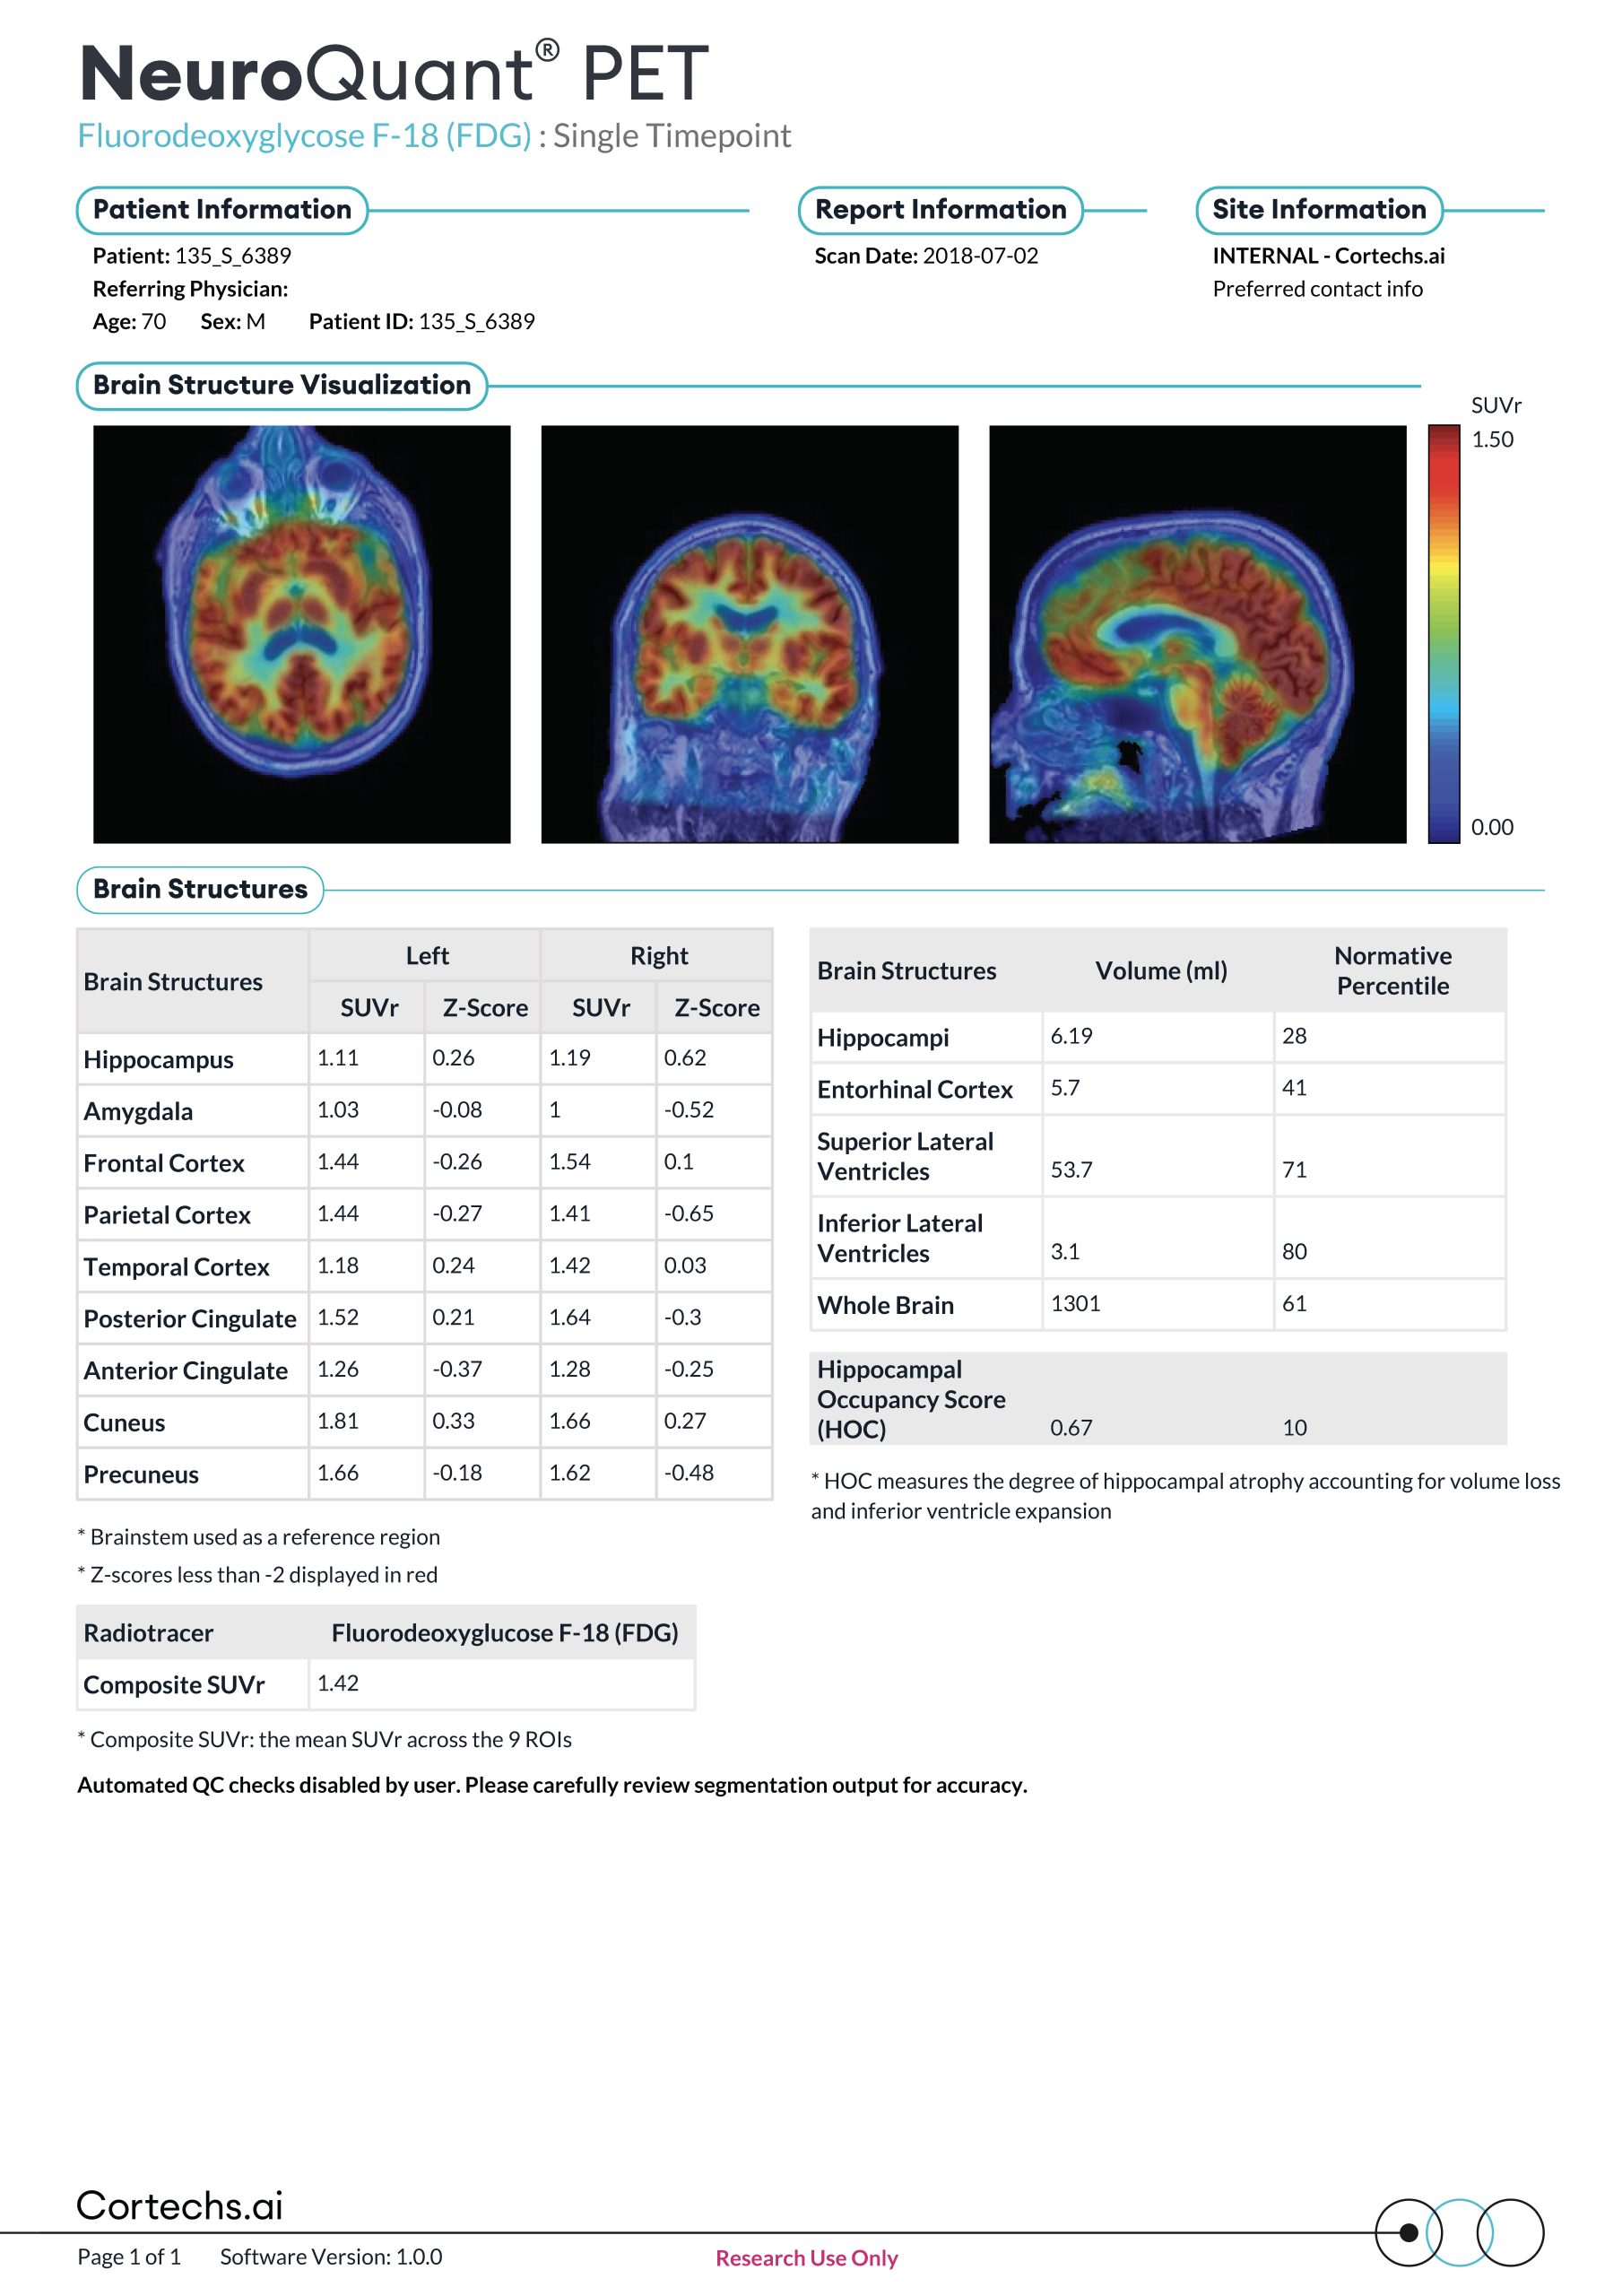
The NeuroQuant® PET FDG Report automatically quantifies metabolic tracer uptake within brain structures, providing visual and statistical comparisons of normalized regional PET tracer values against normative population data.

Florbetaben Report

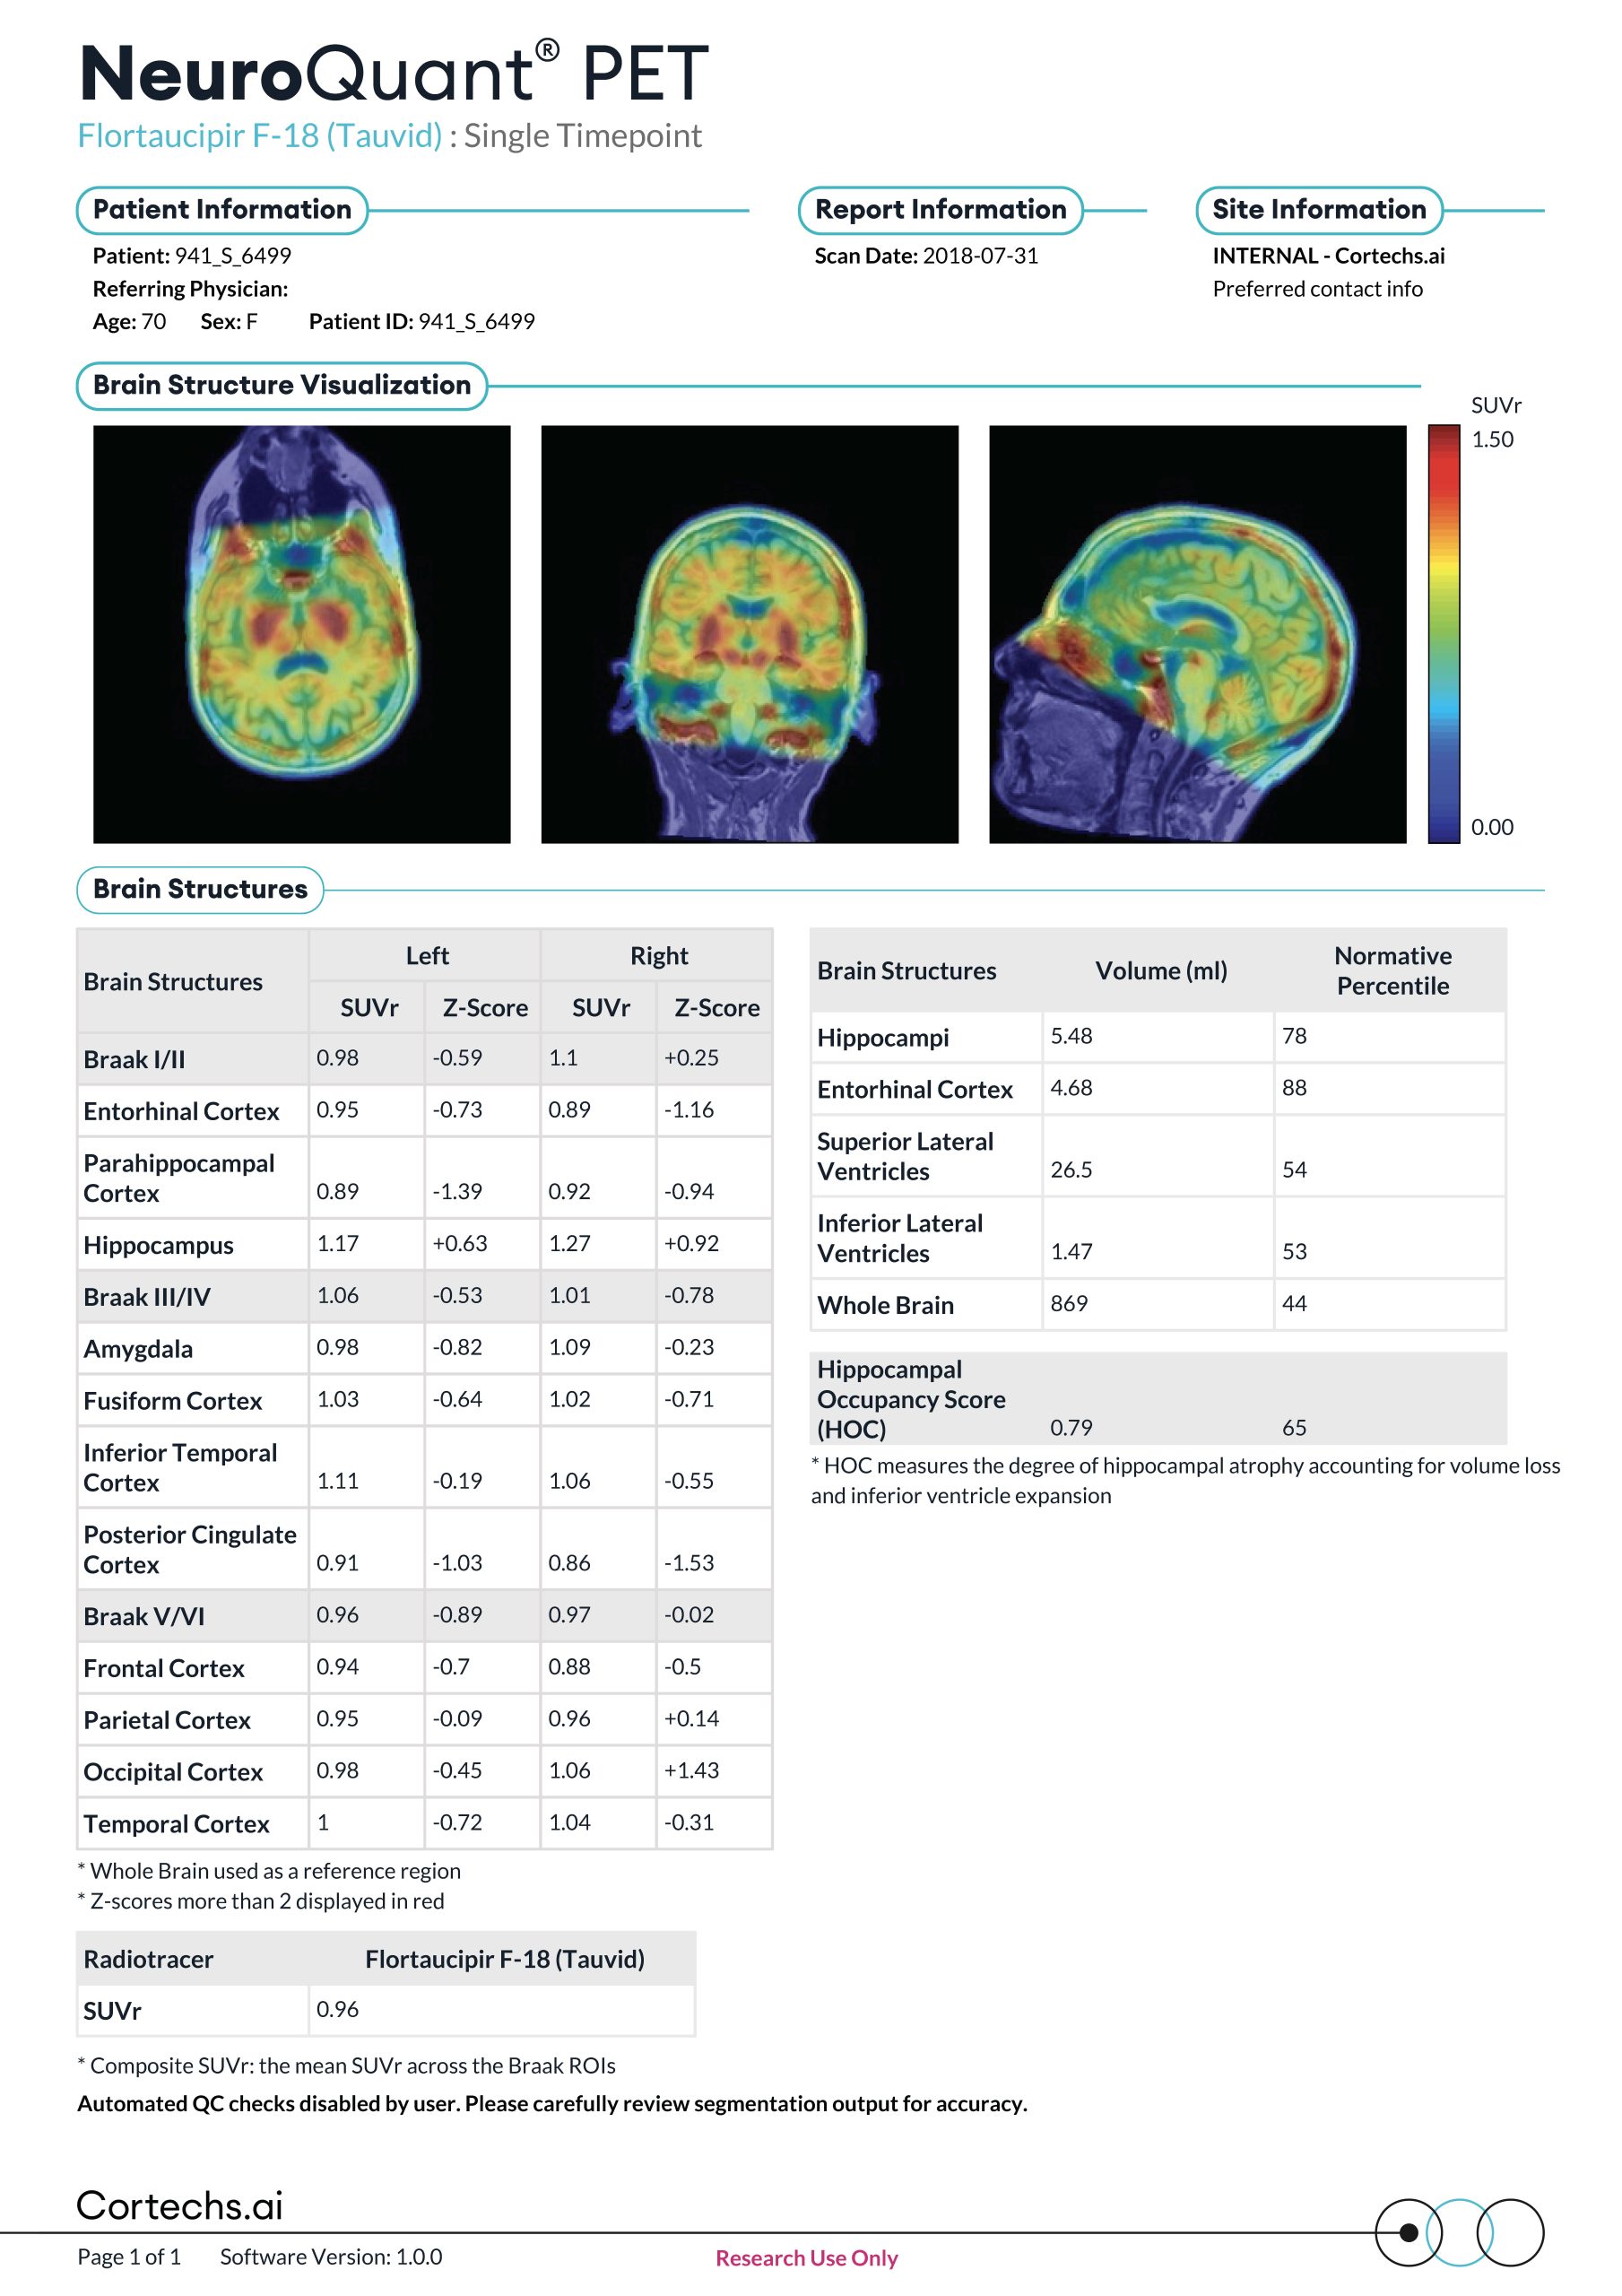
The NeuroQuant® PET Flortaucipir Report automatically quantifies tau tracer uptake within brain structures, providing visual and statistical comparisons of normalized regional PET tracer values against normative population data.

Flortaucipir measures tau rather than amyloid, so the Centiloid reference has been removed.

Take the next step

Blue three-dimensional brain illustration

NeuroQuant® PET

Clearer insights into
amyloid PET imaging.

Discover how NeuroQuant® PET supports amyloid PET interpretation with automated regional quantification and Centiloid scoring. Speak with ARJ Medical for product information or a demonstration.

Request a demo

Let’s discuss your amyloid PET imaging workflow.

Product Enquiry